Hello there. I'm
Leandro Collares
I create web-based visualizations that tell stories and help different audiences make sense of data. I'm looking for opportunities to assist organizations in their data visualization challenges.
About Me
I design and implement interactive visualizations to tell data stories or help individuals explore data in novel ways. By using UX research methods, I help organizations understand people's behaviours, needs and motivations. I am experienced in training, supporting and mentoring people of diverse backgrounds in different contexts as well.
Here are a few frameworks, libraries and tools I've been working with:
- JavaScript
- GeoJSON/TopoJSON
- TypeScript
- Axios
- D3
- Pinia
- Svelte
- Pandas
- Vue
- Folium
- React
- Plotly
- SVG

Selected Projects
Featured Project
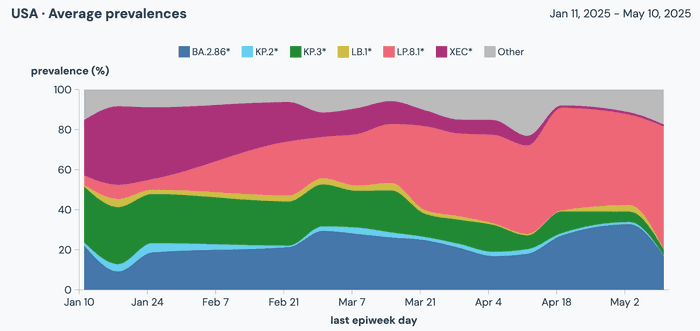
SARS-CoV-2 wastewater surveillance
A page featuring interactive visualizations showing SARS-CoV-2 lineage prevalence trends locally and nationally
Featured Project
SARS-CoV-2 growth rates
A page featuring interactive visualizations that allow visitors to compare growth rates of SARS-CoV-2 lineages across different locations
Featured Project
Taiwan’s most popular street foods
A Svelte-based implementation of the visualization created by Taiwan Data Stories that shows how Taiwan’s most iconic street snacks shifted in popularity over the past 10 years
With Julia Janicki
Featured Project
Life expectancy and income
An interactive scatterplot that displays life expectancy and GDP per capita figures between 1960 and 2018
Featured Project
Human Development Index
An interactive choropleth map that displays human development indices between 1990 and 2018
Other Noteworthy Projects
Check the archive for the complete project list
Street cherry trees in Vancouver
An exploratory data analysis that shows the distribution of different cherry trees across Vancouver
Long range brilliance
A responsive scatterplot showing minutes played and 3-point field goals made by the best 3-point shooters in NBA history
Regular Employment Insurance (EI) beneficiaries in Canada
A responsive line chart showing regular EI beneficiaries in Canada and its provinces and territories between 2019 and 2021
Aboriginals and Immigrants in Canadian Census Metropolitan Areas (CMAs)
A responsive scatterplot that shows the percentages of aboriginals and immigrants in Canadian CMAs
With or without Curry - playoffs
An interactive visualization that allows users to learn when Curry's performance helped Golden State Warriors win games in the 2019 NBA playoffs
COVID-19 in Canada
Linked line charts that show COVID-19 figures in Canadian provinces and territories
